If you ask students preparing for the IELTS exam which module is the most difficult, then the response would be writing and speaking. However, it is easier if they put in the right study strategies. In this article, we mainly focus on the writing section. In the IELTS exam, the writing section is of two parts- task 1 and task 2.
Task 1 consists of a bar chart, pie chart, process diagram, line graph, table, and map where you must explain the given data in your language within the time frame. For impressive writing, you must have a good knowledge of vocabulary and sentence creation. However, due to a lack of vocabulary and other grammatical errors, some students fail to write the content according to the demand of the topic asked in the question. As a result, they lose their band scores in the writing section, which further influences their overall scores.
Are you searching for the best tutors to seek help in writing tasks for IELTS? If yes, then join the best IELTS Institute that offers the best coaching by its most experienced teaching staff.
Here are the tips to follow for writing task 1 in the IELTS exam:
Introduction
In IELTS writing task 1, you are asked to write 150 words for the given topic in the question. The time allotted for the task is 20 mins. In that time you have to properly understand the question and then write about it from your vision. Detailed guidance on the types of questions is given below:
Types of questions
Let’s know the types of illustrations for writing task 1:
Table
It is the type of illustration in the writing task 1. A table is a structure with data arranged in rows and columns. First of all, read the data provided in the table and recognize the category of the data. Then rephrase the title of the table for the introduction. Then figure out the highest and lowest numbers in the table, which makes it easy to write. You can ignore the minor points so that your task does not become lengthy. At last, the conclusion of the text should be concise.
Bar chart
A bar chart is a graph that displays information as rectangular bars that might be vertical or horizontal. The length of the bars correlates to the values they indicate, which are usually quantities. There are normally two axes: one with numerical values and one without it. The best way to solve this type of category is to recognize the biggest and smallest bars and compare them.
Pie Chart
A pie chart is also a graph showing the data in a circular form. It is divided into small pieces of pie. The data is in the form of proportions having different colors of segments to recognize easily the main key pointers. Moreover, sometimes there are two pie charts, in that case, you can write the task by comparing both charts in different periods.
Line Graph
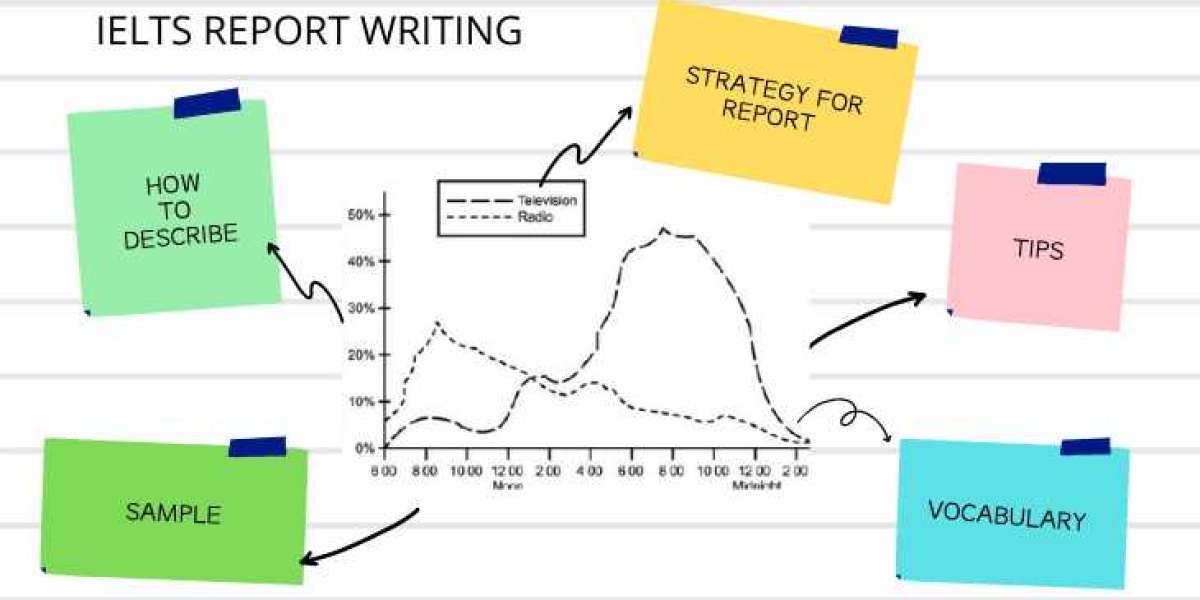
There are two axes in the line graph: horizontal and vertical. Moreover, the vertical line contains the numerical values representing the theme and the horizontal represents the variations with the period. The line graph represents the trends so, the main focus is on the increasing and decreasing trend of the given data within the given period. Therefore, the first thing you need to check is the time grouping in the horizontal axis. Along with this, check the period whether it is in months or years.
Maps
In this type of question, you are provided with two maps showing the same location. All you have to do is the comparison of both maps with the change in period. At first glance, mark the changes in both maps. Along with this, observe the similarities that remain the same in both maps.
Process diagram
The process diagram is a kind of illustration that depicts the different stages of the process making of something or the working process. This category of Writing Task 1 is quite tricky to read. In this type, try to focus on the arrows showing the beginning of the process and write it in the sequence order to make it understandable for the examiner.
Are you preparing for the PTE examination? Join the most promising platform that offers the best PTE Coaching materials to the students to ace the exam most easily.
Wrapping Up
To wrap up, it is quite problematic for most of the students to achieve the desired scores. But following the above-mentioned steps of solving various questions will make you simply crack the writing task.


