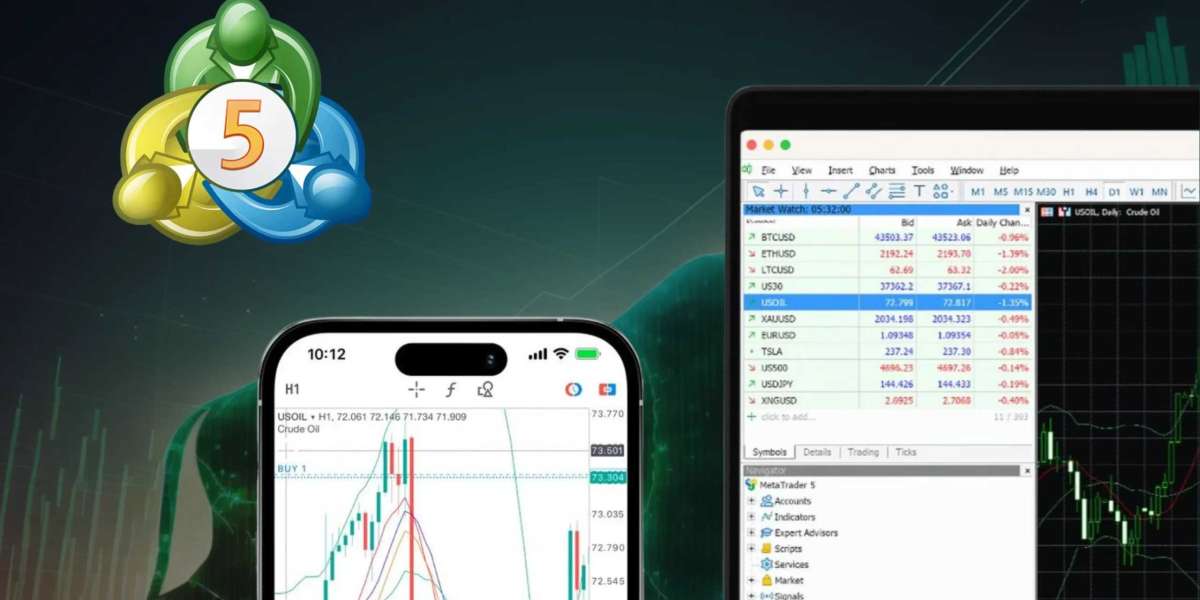
One of the most essential aspects of technical analysis in trading is the use of drawing tools. These tools allow traders to visually represent data, identify trends, and make informed trading decisions. In this article, we’ll explore how to effectively use drawing tools on MetaTrader 5 to enhance your trading experience.
What Are Drawing Tools in MetaTrader 5?
Drawing tools in MT5 are essential for analyzing charts and making informed trading decisions. They include a variety of features such as trendlines, shapes, Fibonacci retracements, channels, and more. By utilizing these tools, traders can visualize market conditions, identify potential support and resistance levels, and better predict future price movements.
How to Access Drawing Tools in MetaTrader 5
Accessing drawing tools in MetaTrader 5 is straightforward. Follow these simple steps:
Open the Chart: Launch your MetaTrader 5 platform and open the chart of the asset you want to analyze.
Locate the Drawing Tools Toolbar: The drawing tools toolbar is typically located at the top of the chart window. If it’s not visible, you can enable it by right-clicking on the toolbar area and selecting “Drawing Tools” from the menu.
Select a Tool: Click on the desired drawing tool from the toolbar. You’ll see various options such as trendlines, horizontal lines, Fibonacci retracement, and shapes.
Commonly Used Drawing Tools and Their Applications

Trendlines
Trendlines are fundamental tools that help traders identify the direction of the market. To draw a trendline in MT5:
- Select the Trendline Tool from the drawing tools toolbar.
- Click on the Chart: Click on the starting point of your trendline, then drag to the desired endpoint.
- Adjust as Necessary: You can click and drag the endpoints to reposition the trendline as needed.
Trendlines can help traders spot potential breakout points and make predictions about future price movements.
Horizontal and Vertical Lines
Horizontal and vertical lines are great for identifying support and resistance levels. Here’s how to use them:
- Select the Horizontal Line Tool or the Vertical Line Tool from the toolbar.
- Click on the Chart: For a horizontal line, click where you want to place it. For a vertical line, click on the time frame you want to mark.
- Adjust the Lines: Click and drag the lines to adjust their positions.
These lines can help traders visualize key levels where price tends to reverse or consolidate.
Fibonacci Retracement
Fibonacci retracement is a popular tool among traders for identifying potential reversal levels. To use this tool:
- Select the Fibonacci Retracement Tool from the drawing tools.
- Click on the Chart: Click at the start of the move you want to analyze, then drag to the endpoint.
- Adjust Levels: The Fibonacci levels will automatically appear on your chart.
This tool is especially useful during a trending market, as it can help traders spot potential entry points.
Shapes and Text
Shapes and text can enhance your analysis by providing visual markers and notes on your charts. To add shapes or text:
- Select the Shapes Tool (e.g., rectangles, ellipses) or the Text Tool from the toolbar.
- Draw on the Chart: Click and drag to create shapes or click to place text.
- Edit Properties: Right-click on the shape or text to adjust its properties, such as color and size.
Using shapes and text can make your charts more informative and personalized.

Saving Your Chart Setup
After customizing your chart with various drawing tools, it’s essential to save your setup for future reference. Here’s how to do it:
- Right-click on the Chart: In the chart area, right-click to open the context menu.
- Select “Template”: Hover over the “Template” option.
- Choose “Save Template”: Name your template and click “Save.”
Next time you open the chart, you can quickly apply your saved template to restore your drawing tools and settings.
Tips for Using Drawing Tools Effectively
- Be Consistent: Use drawing tools consistently across different charts to maintain clarity and facilitate analysis.
- Combine Tools: Combining different drawing tools can provide more comprehensive insights into market conditions.
- Keep It Simple: Avoid cluttering your chart with too many indicators and lines. Focus on key levels that matter to your trading strategy.
Downloading Exness MT5
To start using drawing tools effectively on MetaTrader 5, you first need to download the platform. A reliable option is Exness MT5 download which provides a user-friendly interface and seamless trading experience. Visit the Exness website to download the MT5 platform and start your trading journey today.
Conclusion
Drawing tools in MetaTrader 5 are invaluable for traders looking to enhance their technical analysis. By understanding how to access and utilize these tools effectively, you can improve your trading strategies and make more informed decisions. Whether you’re drawing trendlines, Fibonacci retracements, or adding shapes and text, mastering these tools can give you a competitive edge in the market. Don't forget to download the Exness MT5 platform to start your journey into effective trading analysis!


